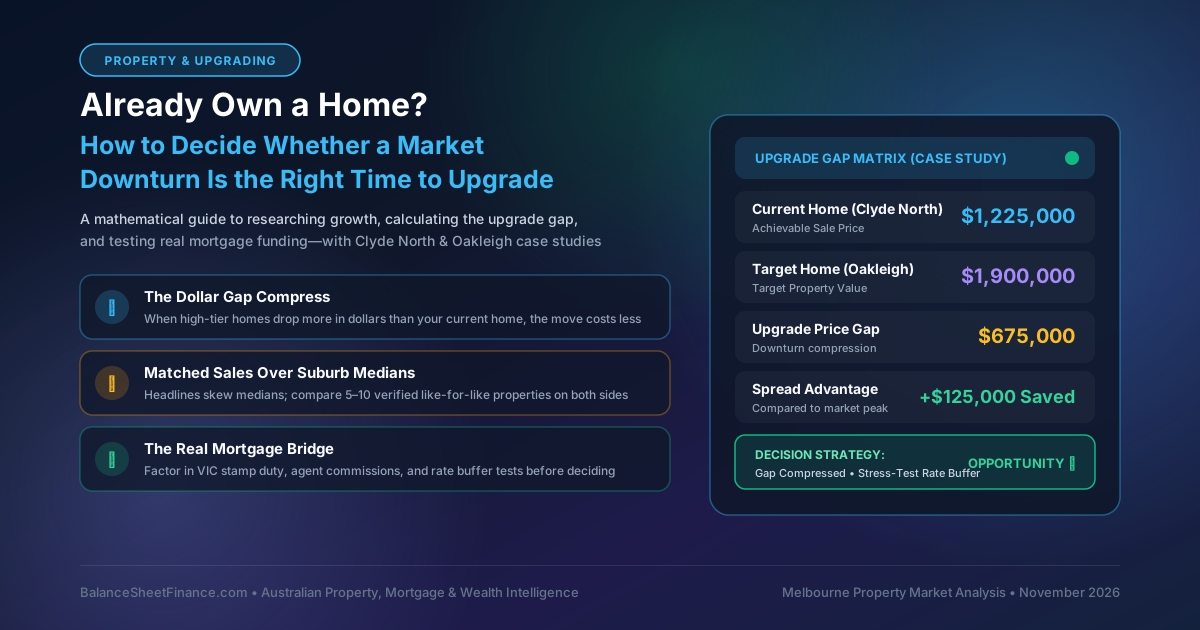
Your next home may have become cheaper. But has it become cheaper compared with the home you already own?
When property prices weaken across Australian capital cities, homeowners often think: “I should wait until my house is worth more before selling.”
That sounds sensible on the surface. But what if the house you want to buy has fallen by an even larger dollar amount?
For someone who already owns a home, a property downturn can create a compelling mathematical window to move to a suburb that better suits their family's long-term lifestyle. The entire decision depends on the relationship between two specific markets: the one you are selling out of and the one you are buying into.
This guide explains how to research both suburbs, calculate true compound historical growth, test future 5-year scenarios, and decide whether an upgrade is worth its friction costs. We will use two reader-selected properties in Clyde North and Oakleigh to demonstrate why verifying the underlying data matters.
The Central Idea: Research past growth to understand market character, measure today's dollar price gap to assess the opportunity, and test the full borrowing cost before committing. A suburb's historical reputation and a generic “market is down” headline are never enough.
#1. Start with the Two Sample Properties—and Check the Dates
To see how easily real estate figures can mislead buyers, let's examine two substantial family homes supplied by readers:
| Property Detail | Clyde North Example | Oakleigh Example |
|---|---|---|
| Address | 21 Khan Boulevard, Clyde North VIC | 33 Abbeygate Street, Oakleigh VIC |
| Original Sold Listing | 5 bedrooms, 5 bathrooms, 2-car garage | 5 bedrooms, 3 bathrooms, 2-car garage |
| Listed Land Area | Approximately 457 m² | Approximately 547 m² |
| Price on Supplied Sold Page | $1,225,000 | $1,820,000 |
| Date on Supplied Sold Page | 13 October 2026 | 28 September 2017 |
Sources: Clyde North sold listing and Oakleigh sold listing.
These are both useful examples of premium, multi-bedroom family homes. However, the two recorded sale prices are nine years apart. Simply subtracting $1.225 million from $1.820 million does not establish today's cost of moving between equivalent properties.
Furthermore, discrepancies appear in the public records for the Oakleigh home:
- Its property history profile records the $1.82 million transaction on 9 May 2018, describes 4 bedrooms with no off-street parking, and states a 2009 build year.
- The original marketing advertisement describes a study/fifth bedroom and a double lockup garage.
- If the recorded build year is accurate, the home is a 17-year-old dwelling in 2026, whereas the Clyde North home is near-new construction.
Source: Oakleigh property profile & history.
The Upgrader's Rule: Always verify what the raw data describes before plugging numbers into a mortgage or upgrade calculator. A past listing illustrates architectural style and layout, but does not establish its current valuation or market availability.
#2. Check Whether Your Particular Market Is Actually Down
Broad media claims that “Melbourne property is down” or “Sydney is cooling” do not mean every suburb, school zone, price tier, and dwelling type has fallen at the same velocity.
Looking at realestate.com.au suburb profiles accessed on 2 November 2026 for the rolling period of October 2025 – September 2026:
| Published Measure | Clyde North (Outer South-East) | Oakleigh (Middle-Ring East) | Market Difference |
|---|---|---|---|
| All-House Median Sale Price | $752,500 | $1,351,500 | +$599,000 (+79.6%) |
| Published 12-Month Median Growth | +3.1% | +1.6% | Clyde North grew faster |
| 4-Bedroom House Median | $779,000 | $1,481,000 | +$702,000 (+90.1%) |
| 4-Bedroom 12-Month Growth | +4.6% | −1.3% | Oakleigh compressed 5.9% relative |
| All-House Sales Volume (12 Mo) | 1,115 sales | 70 sales | 16x higher transaction liquidity |
| 4-Bedroom Sales Volume (12 Mo) | 695 sales | 24 sales | Highly concentrated sample |
Sources: Clyde North suburb profile and Oakleigh suburb profile.
These figures reveal nuanced market divergence:
- Divergent Tier Movement: While all-house medians in both suburbs grew modestly (+3.1% and +1.6%), the 4-bedroom family segment in Oakleigh softened by −1.3%, whereas Clyde North 4-bedroom homes appreciated by +4.6%.
- Relative Purchasing Power Improvement: For an owner selling a 4-bedroom home in Clyde North to buy a 4-bedroom home in Oakleigh, the relative pricing spread improved over that 12-month period.
- Liquidity Differences: Clyde North saw 695 four-bedroom sales (an active, high-volume growth corridor), while Oakleigh recorded just 24 sales across the entire year.
#Understand What a Suburb Median Really Means
A suburb median is simply the middle transaction price among all homes sold during a specific window. If more lower-priced villas or unrenovated weatherboards sell in a quarter, the median drops even if premium turnkey homes have not lost value.
Conversely, a small annual sample (such as 24 sales in Oakleigh) is vulnerable to mix skew. You cannot value a premium 5-bedroom home by universally applying an all-house median percentage.
For deeper analysis on research methods, see the Real Estate Institute of Victoria (REIV) Research Guide and Cotality's property index methodology.
#3. Research Both Suburbs Using the Same Method
Before drawing conclusions about an upgrade opportunity, compile a standardised comparison matrix across both locations:
| What to Collect | Primary Reliable Sources | How to Apply to Your Decision |
|---|---|---|
| Recent Sold Evidence | realestate.com.au Sold, Domain Sold, agent reported records | Establish what active buyers are actually paying right now |
| Historical Address Transactions | Land title records, historical sales history | Isolate true capital appreciation on identical physical assets |
| 1-, 5-, and 10-Year Suburb History | REIV, Valuer-General Victoria, suburb profiles | Compare the durability and cyclical resilience of long-term trends |
| Sales Volume & Measurement Windows | Same report and date range | Identify statistical noise and illiquid micro-markets |
| Days on Market & Vendor Discounting | Suburb quarterly reports, tracked listings | Gauge vendor urgency and negotiation leverage |
| Zoning, Infrastructure & Pipeline | VicPlan, council planning registers, transport audits | Evaluate whether future supply could dilute or enhance land value |
The Valuer-General Victoria property sales statistics provide an authoritative public benchmark for settled evidence.
Data Consistency Principle: Always compare data from the same provider, property category, start date, and end date. Comparing one suburb's rolling annual median with another suburb's quarterly median will produce distorted, artificial conclusions.
#Narrow Down to 5–10 Genuine Comparables
Once suburb-level data is documented, collect 5 to 10 comparable settled sales in both your current neighbourhood and your target suburb:
- Match detached houses with detached houses (exclude townhouses and subdivided units unless they form part of your search).
- Compare usable land area, internal floor area, architectural age, structural condition, bathroom counts, garage capacity, street orientation, and school catchment zones.
- Commission independent appraisals from two or three active local selling agents.
- Establish a conservative (low), central, and optimistic (high) valuation range for both properties.
#4. Calculate Historical Capital Growth Correctly
When reviewing historical price growth, apply two mathematical formulas:
#A. Total Capital Growth
$$\text{Total Growth (\%)} = \left(\frac{\text{End Value}}{\text{Start Value}} - 1\right) \times 100$$
If a property was worth $750,000 five years ago and sells for $1,000,000 today:
$$\left(\frac{\$1,000,000}{\$750,000} - 1\right) \times 100 = 33.3\% \text{ total growth}$$
This measures the cumulative return over the entire five-year span.
#B. Compound Annual Growth Rate (CAGR)
To determine the steady annualized compounding rate:
$$\text{Annual Growth Rate (\%)} = \left[\left(\frac{\text{End Value}}{\text{Start Value}}\right)^{\frac{1}{\text{years}}} - 1\right] \times 100$$
Using the same example:
$$\left[\left(\frac{\$1,000,000}{\$750,000}\right)^{\frac{1}{5}} - 1\right] \times 100 = 5.92\% \text{ per annum}$$
In Microsoft Excel or Google Sheets (assuming Start Value in A2, End Value in B2, and Years in C2):
- Total Growth:
=B2/A2 - 1 - Annual Compound Growth:
=(B2/A2)^(1/C2) - 1 - For exact transaction dates: replace
C2withYEARFRAC(StartDateCell, EndDateCell, 3).
#Do Not Confuse Construction Spending with Market Growth
The property history for 21 Khan Boulevard records $453,000 in March 2024 and $1,225,000 in October 2026. Pure arithmetic shows a +$772,000 increase (+170.4%).
However, this does not represent 170% capital growth. The initial $453,000 transaction was for vacant land. The owner subsequently spent hundreds of thousands of dollars on architectural plans, permits, civil site works, builder contracts, finishes, landscaping, and holding interest to construct a 5-bedroom, 5-bathroom residence.
Source: Khan Boulevard property history.
When assessing personal investment performance, always account for total capital invested. When assessing suburb capital growth, only measure transactions of existing, like-for-like completed homes.
#5. Measure Whether the Upgrade Gap Has Narrowed
Once you have current market value ranges for both homes:
$$\text{Upgrade Price Gap} = \text{Target Property Price} - \text{Achievable Sale Price of Current Home}$$
Assume an upgrader owns a Clyde North home comparable to Khan Boulevard that could achieve $1,225,000 today, and wishes to buy an established Oakleigh family home valued at $1,900,000.
Now compare how that gap behaved at the peak of the market versus during a downturn:
| Market Scenario | Current Home (Clyde North) | Target Home (Oakleigh) | Dollar Upgrade Gap |
|---|---|---|---|
| Market Peak (Past) | $1,300,000 | $2,100,000 | $800,000 |
| Downturn (Today) | $1,225,000 | $1,900,000 | $675,000 |
| Net Price Movement | −$75,000 (−5.8%) | −$200,000 (−9.5%) | Gap Narrows by $125,000 |
Note: Past peak values are illustrative benchmark assumptions.
Selling your current family home for $75,000 below its previous peak may feel emotionally frustrating. However, because the target home in the more expensive suburb declined by $200,000, the pre-cost capital spread you must bridge has shrunk by $125,000.
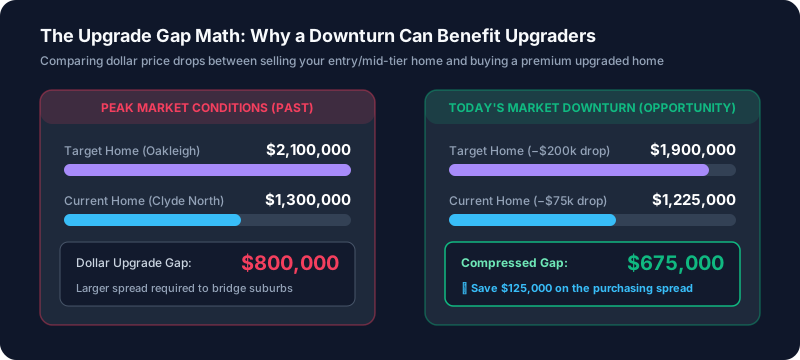
The Mathematical Rule of Upgrading: In a broad market downturn, higher-value properties typically drop by more absolute dollars than mid-tier properties. A 10% pullback on a $2,000,000 home is −$200,000, whereas a 10% pullback on a $1,000,000 home is −$100,000. Upgraders benefit from the compressed dollar spread.
#6. Ask What Happens If You Wait: 5-Year Scenarios
Historical performance illustrates past cycles; it does not guarantee what either market will do over the next decade.
To test your exposure, model future value projections:
$$\text{Future Value} = \text{Current Value} \times (1 + g)^{\text{years}}$$
Starting from today's $1,225,000 and $1,900,000 benchmarks:
| 5-Year Scenario | Current Home Growth ($g_1$) | Target Home Growth ($g_2$) | Current Home Value (Year 5) | Target Home Value (Year 5) | Resulting Upgrade Gap | Net Gap Change |
|---|---|---|---|---|---|---|
| Today's Starting Point | — | — | $1,225,000 | $1,900,000 | $675,000 | Baseline |
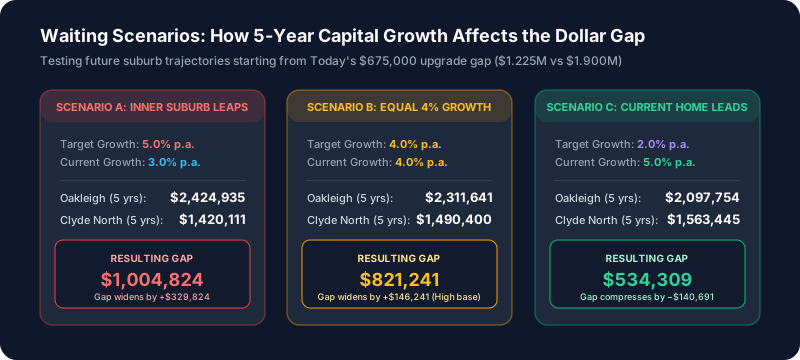
| Scenario A: Inner Suburb Leaps | +3.0% p.a. | +5.0% p.a. | $1,420,111 | $2,424,935 | $1,004,824 | Widens by +$329,824 |
| Scenario B: Equal 4% Growth | +4.0% p.a. | +4.0% p.a. | $1,490,400 | $2,311,641 | $821,241 | Widens by +$146,241 |
| Scenario C: Outer Suburb Outpaces | +5.0% p.a. | +2.0% p.a. | $1,563,445 | $2,097,754 | $534,309 | Narrows by −$140,691 |
Hypothetical compound projections excluding transaction frictions and maintenance.
#Key Takeaways from Scenario Modelling:
- The Compounding Base Effect: In Scenario B, even when both suburbs grow at the exact same rate (4.0% p.a.), the dollar gap widens by +$146,241 over five years because 4% on $1.90M generates far more absolute dollars than 4% on $1.225M.
- The 1-Year Reality Check: Over just 12 months, if Clyde North grows 4% (+$49,000) and Oakleigh grows 3% (+$57,000), the gap still widens by $8,000 despite the current home achieving a higher percentage rate.
- The Opportunity Cost of Waiting: Waiting for market recovery only helps you if you are saving and paying down debt faster than the widening dollar spread between the two property tiers.
#7. A “Better Suburb” Requires Structural Evidence
A higher median price tag does not guarantee that a suburb will deliver superior future returns. Investigate the structural supply-and-demand fundamentals:
| Fundamental Factor | What to Investigate | How It Shapes Long-Term Value |
|---|---|---|
| Everyday Amenity & Commute | Direct rail connectivity, major road access, school zones | Permanent demand from owner-occupiers who prioritize lifestyle and time |
| Supply Constraints | Council zoning, heritage overlays, vacant land availability | Land scarcity in established suburbs prevents sudden competing supply |
| Infrastructure Pipeline | Health precincts, transport hubs, shopping town centres | Transformative capital works can accelerate capital growth in emerging suburbs |
| Property-Specific Nuances | Easements, traffic noise, flight paths, building defects | Avoid paying a suburb premium for an impaired micro-location |
Choose a home that enhances your family's quality of life even if capital growth is modest. Never rely on speculative future capital gains to bail out an unsustainable mortgage.
#8. Turn the Price Gap into a Real Mortgage Calculation
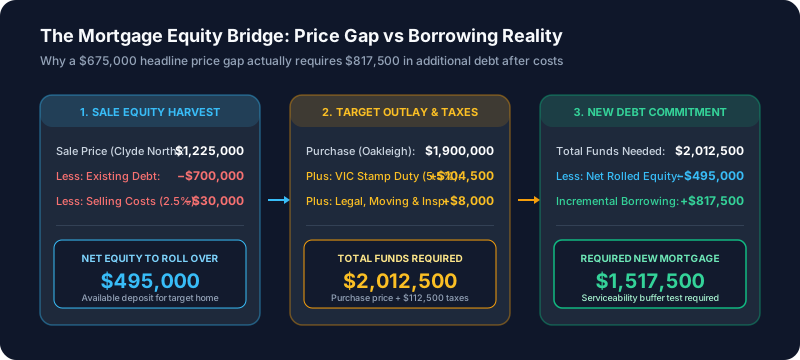
A $675,000 headline price difference does not equal $675,000 of new borrowing. Transaction costs, state taxes, and loan discharges add significant friction:
| Step in Funding Waterfall | Accounting Breakdown | Cumulative Capital Position |
|---|---|---|
| Achievable Sale Price (Clyde North) | $1,225,000 | Gross proceeds |
| Less: Existing Mortgage Payoff | −$700,000 | Assumed remaining debt |
| Less: Selling Agency Fees & Marketing (2.5%) | −$30,000 | Professional sales fees |
| Less: Legal Settlement & Discharge Fees | −$1,500 | Conveyancing |
| Net Available Rolled Equity | $495,000 | Liquid deposit for purchase |
| Target Purchase Price (Oakleigh) | $1,900,000 | Acquisition cost |
| Plus: Victorian Land Transfer Duty (Stamp Duty) | +$104,500 | SRO general rate (~5.5%) |
| Plus: Buyer Conveyancing, Pest & Building Inspection | +$3,500 | Due diligence |
| Plus: Removalists & Utility Setup | +$4,500 | Physical moving outlays |
| Total Acquisition Capital Required | $2,012,500 | Purchase + $112,500 friction costs |
| Less: Rolled Equity Applied | −$495,000 | Reinvested sales proceeds |
| Less: Additional Cash Savings Deployed | $0 | Reserves kept for safety |
| Required New Mortgage Facility | $1,517,500 | +$817,500 above existing debt |
The general Victorian transfer duty for this purchase is 5.5% ($104,500). Verify exact stamp duty brackets using the Victorian State Revenue Office (SRO) Land Transfer Duty Calculator.
$$\text{New Loan} = \text{Purchase Price} + \text{Buying Costs} - (\text{Sale Proceeds} - \text{Existing Debt} - \text{Selling Costs}) - \text{Cash Savings Deployed}$$
While the price gap is $675,000, the household must borrow $817,500 in additional funds, taking their total loan from $700,000 to $1,517,500.
Stress-Test Serviceability First: Before committing to an upgrade contract, stress-test your monthly repayment at a rate 2.0% to 3.0% higher than today's variable rate. Compare lenders and rate structures using the BalanceSheet Mortgage Rates Comparison Tool and map your complete assets and liabilities on the BalanceSheet Financial Position Tool.
#9. Compare Moving with Staying on Fair Terms
To evaluate whether upgrading is financially sound, compare projected 10-year net wealth and household cash flow, rather than focusing solely on future property values:
| Financial Dimension | Scenario A: Staying & Investing | Scenario B: Upgrading Home |
|---|---|---|
| Property Equity | Value of current home less remaining $700k loan | Value of target home less new $1.517M loan |
| Monthly Mortgage Outlay | Lower repayment enables surplus monthly cash | Higher repayment absorbs discretionary cash flow |
| Surplus Cash Allocation | Directed to offset, superannuation, or shares | Directed into building equity in the primary residence |
| Transaction Frictions | $0 lost in stamp duty or agent fees | $142,500 lost to taxes, commissions, and fees |
| Lifestyle & Living Quality | Requires living with space/commute compromises | Delivers desired lifestyle, school access, and space |
If upgrading requires stretching borrowing to maximum capacity, any unexpected life event (parental leave, career transitions, health expenses) can create severe financial stress. Conversely, a move can be deeply worthwhile for family wellbeing even if it does not mathematically maximize net wealth.
#10. A Practical Decision Framework for Upgraders
Follow this 4-phase, 8-step decision process before signing contracts:
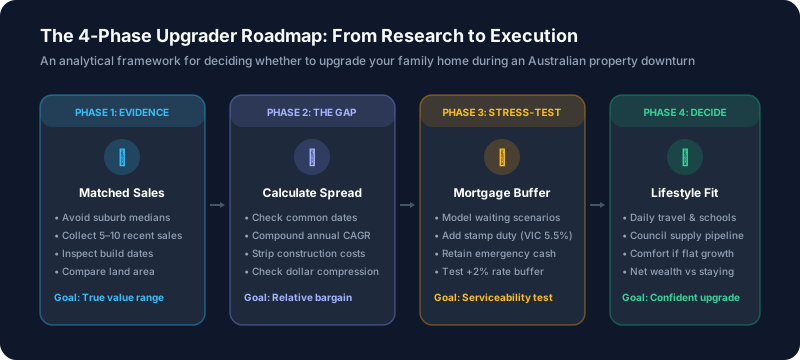
- Phase 1: Define & Match:
- Establish non-negotiable criteria (suburb, block size, bedrooms, schooling, commute).
- Collect 5–10 recent verified comparable sales on both sides; discard misleading suburb medians.
- Phase 2: Calculate the Real Spread:
- Verify historical compound annual growth (CAGR) across common dates.
- Separate construction expenditure from pure market appreciation.
- Calculate today's dollar price gap compared to the previous market peak.
- Phase 3: Stress-Test Scenarios & Lending:
- Model 5-year waiting scenarios (Scenario A, B, and C).
- Build a complete funding waterfall including stamp duty, agent fees, and legal costs.
- Ensure you retain an emergency cash reserve of at least 3–6 months' living expenses.
- Phase 4: Decide on Lifestyle & Resilience:
- Audit local council planning pipelines and competing land supply.
- Ensure the household budget remains comfortable even under sustained high interest rates.
- Proceed when the move offers genuine long-term living benefits and structural financial resilience.
#Related Financial Intelligence & Tools on BalanceSheet
- Australian Mortgage Interest Rates: 2026 Spring Market Outlook & Strategy
- Inflation & Interest Rate Hikes in Australia: Is Raising Rates the Right Answer?
- How to Use an SMSF to Buy Property in Victoria: A Step-by-Step Guide
- Compare Current Australian Mortgage Rates & Lender Switching Buffers
- Calculate Household Net Worth & Debt Trajectories on BalanceSheet
#Sources and Data Notes
- 21 Khan Boulevard, Clyde North—Supplied Sold Listing
- 21 Khan Boulevard, Clyde North—Property History & Title Records
- 33 Abbeygate Street, Oakleigh—Supplied Sold Listing
- 33 Abbeygate Street, Oakleigh—Property Profile & History
- Clyde North Suburb Profile & Median Analytics
- Oakleigh Suburb Profile & Median Analytics
- Real Estate Institute of Victoria (REIV)—About Our Research
- Valuer-General Victoria—Property Sales Resources & Statistics
- Cotality—Australian Property Indices and Methodologies
- State Revenue Office (SRO) Victoria—Land Transfer Duty Rates
Published 2 November 2026. All currency values are in Australian Dollars (AUD). Published market data is a dated snapshot and subject to retrospective revisions by statistical agencies. Historical listing discrepancies in publicly supplied properties remain unresolved; no specific current valuation or verified growth rate for either individual sample home is claimed. Hypothetical prices, interest rates, and friction costs illustrate the calculation methodology and do not constitute financial forecasts. This publication provides general educational information and does not constitute personal financial, credit, or legal advice.